Grundlæggende statistik
| Institutionelle ejere | 574 total, 562 long only, 0 short only, 12 long/short - change of -2,66% MRQ |
| Gennemsnitlig porteføljeallokering | 0.4797 % - change of 9,68% MRQ |
| Institutionelle aktier (lange) | 625.107.130 (ex 13D/G) - change of 65,35MM shares 9,97% MRQ |
| Institutionel værdi (lang) | $ 17.515.967 USD ($1000) |
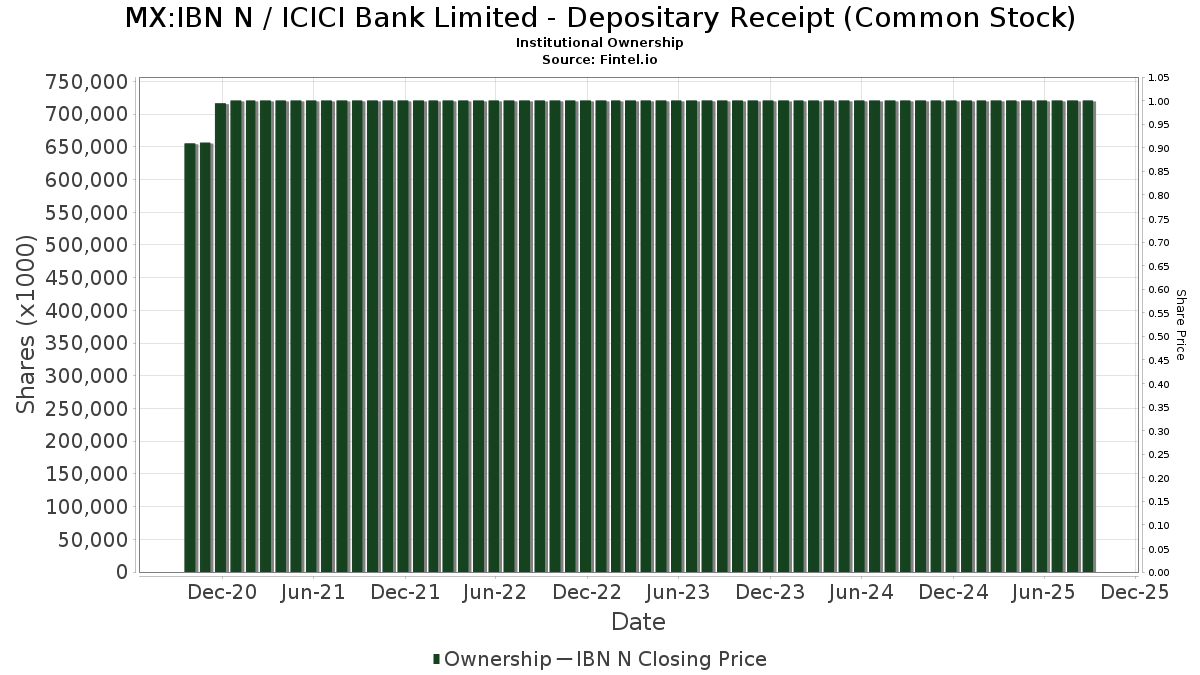
Institutionelt ejerskab og aktionærer
ICICI Bank Limited - Depositary Receipt (Common Stock) (MX:IBN N) har 574 institutionelle ejere og aktionærer, der har indsendt 13D/G- eller 13F-formularer til Securities Exchange Commission (SEC). Disse institutioner har i alt 625,107,130 aktier. Største aktionærer omfatter GQG Partners LLC, Morgan Stanley, Wcm Investment Management, Llc, Temasek Holdings (Private) Ltd, Invesco Ltd., Robeco Institutional Asset Management B.V., Jpmorgan Chase & Co, Capital International Investors, Dimensional Fund Advisors Lp, and Ninety One UK Ltd .
ICICI Bank Limited - Depositary Receipt (Common Stock) (BMV:IBN N) institutionel ejerskabsstruktur viser aktuelle positioner i virksomheden efter institutioner og fonde, samt seneste ændringer i positionsstørrelse. Større aktionærer kan omfatte individuelle investorer, investeringsforeninger, hedgefonde eller institutioner. Skema 13D angiver, at investoren besidder (eller besidder) mere end 5 % af virksomheden og har til hensigt (eller har til hensigt at) aktivt at forfølge en ændring i forretningsstrategi. Skema 13G indikerer en passiv investering på over 5%.
Fondens stemningsscore
Fund Sentiment Score (fka Ownership Accumulation Score) finder de aktier, der bliver mest købt af fonde. Det er resultatet af en sofistikeret, multi-faktor kvantitativ model, der identificerer virksomheder med de højeste niveauer af institutionel akkumulering. Scoringsmodellen bruger en kombination af den samlede stigning i oplyste ejere, ændringerne i porteføljeallokeringer i disse ejere og andre målinger. Tallet går fra 0 til 100, hvor højere tal indikerer et højere niveau af akkumulering for sine jævnaldrende, og 50 er gennemsnittet.
Opdateringsfrekvens: Dagligt
Se Ownership Explorer, som giver en liste over højest rangerende virksomheder.
AI+ Ask Fintel’s AI assistant about ICICI Bank Limited - Depositary Receipt (Common Stock).
Select a question to share a public post with an AI-crafted answer.
Thinking of good questions…
13F og NPORT arkivering
Detaljer om 13F-arkivering er gratis. Detaljer om NP-ansøgninger kræver et premium-medlemskab. Grønne rækker angiver nye positioner. Røde rækker angiver lukkede positioner. Klik på linket ikon for at se den fulde transaktionshistorik.
Opgrader
for at låse premium-data op og eksportere til Excel ![]() .
.
| Fil dato | Kilde | Investor | Type | Gennemsnitlig pris (Øst) |
Aktier | Δ Aktier (%) |
Rapporteret Værdi ($1000) |
Δ Værdi (%) |
Port Alloc (%) |
|
|---|---|---|---|---|---|---|---|---|---|---|
| 2026-02-17 | 13F | Aperture Investors, LLC | 0 | -100,00 | 0 | |||||
| 2026-02-11 | 13F | Empowered Funds, LLC | 148.497 | 4.425 | ||||||
| 2026-02-13 | 13F | Walleye Trading LLC | 93.295 | -43,76 | 2.780 | -44,56 | ||||
| 2026-04-08 | 13F | Wealth Science Advisors LLC | 89 | 3 | ||||||
| 2026-02-13 | 13F | Parkside Financial Bank & Trust | 162 | 0,00 | 5 | 0,00 | ||||
| 2026-02-17 | 13F | Old Mission Capital Llc | 339.316 | 10.112 | ||||||
| 2026-02-13 | 13F | Aviso Financial Inc. | 0 | -100,00 | 0 | |||||
| 2026-02-17 | 13F | Gilder Gagnon Howe & Co Llc | 996.262 | -2,30 | 29.689 | -3,69 | ||||
| 2026-02-17 | 13F | Summit Global Investments | 58.336 | -1,98 | 2 | 0,00 | ||||
| 2026-02-13 | 13F | Walleye Trading LLC | Put | 16.700 | -57,51 | 498 | -58,16 | |||
| 2026-02-13 | 13F | Walleye Trading LLC | Call | 27.600 | 8,66 | 822 | 7,17 | |||
| 2026-04-02 | 13F | Byrne Asset Management LLC | 350 | -36,36 | 9 | -43,75 | ||||
| 2026-01-28 | 13F | SP Asset Management LLC | 35.361 | 0,00 | 1.054 | -1,40 | ||||
| 2026-02-13 | 13F | Colony Group, LLC | 32.352 | 30,38 | 964 | 28,53 | ||||
| 2026-03-31 | 13F | Hamrick Investment Counsel, llc | 60 | 2 | ||||||
| 2026-02-06 | 13F | Leonteq Securities AG | 130.382 | 66,62 | 3.885 | 64,27 | ||||
| 2026-02-12 | 13F | BRYN MAWR TRUST Co | 445 | -4,09 | 13 | -7,14 | ||||
| 2026-02-17 | 13F | Lazard Asset Management Llc | 3.860.922 | -5,93 | 115.055 | -7,27 | ||||
| 2026-02-12 | 13F | Aviva Plc | 93.554 | -0,76 | 2.788 | -2,18 | ||||
| 2026-02-13 | 13F | Headlands Technologies LLC | 100.617 | 685,46 | 2.998 | 674,68 | ||||
| 2025-11-26 | 13F/A | Jpmorgan Chase & Co | Put | 0 | -100,00 | 0 | -100,00 | |||
| 2026-02-09 | 13F | Mondrian Investment Partners LTD | 4.177 | 21,21 | 124 | 19,23 | ||||
| 2026-02-11 | 13F | Cerity Partners LLC | 214.699 | -1,94 | 6.398 | -3,34 | ||||
| 2026-04-22 | 13F | Continuum Advisory, LLC | 89.282 | 30,39 | 2.312 | 13,33 | ||||
| 2026-04-23 | 13F | CWM Advisors, LLC | 2.799 | 7,41 | 73 | -6,49 | ||||
| 2026-02-09 | 13F | Hartland & Co., LLC | 25.654 | -3,63 | 764 | -4,98 | ||||
| 2025-11-14 | 13F | Binnacle Investments Inc | 1.666 | 0,00 | 50 | -10,71 | ||||
| 2026-02-13 | 13F | American Century Companies Inc | 5.344.540 | -2,46 | 159.267 | -3,84 | ||||
| 2026-02-17 | 13F | Engineers Gate Manager LP | 219.917 | 6.554 | ||||||
| 2025-11-14 | 13F | Eqis Capital Management, Inc. | 0 | -100,00 | 0 | |||||
| 2026-02-13 | 13F | NLB Skladi, upravljanje premozenja, d.o.o. | 354.861 | 10.575 | ||||||
| 2026-04-09 | 13F | Nelson, Van Denburg & Campbell Wealth Management Group, LLC | 12.730 | 5,42 | 330 | -8,36 | ||||
| 2026-01-29 | 13F | Veracity Capital LLC | 0 | -100,00 | 0 | |||||
| 2026-02-03 | 13F | Crossmark Global Holdings, Inc. | 117.862 | 0,18 | 3.512 | -1,24 | ||||
| 2026-02-11 | 13F | Winton Capital Group Ltd | 14.500 | 432 | ||||||
| 2026-02-13 | 13F | First Trust Advisors Lp | 126.154 | -0,42 | 3.759 | -1,83 | ||||
| 2026-04-15 | 13F | Merit Financial Group, LLC | 22.207 | -0,43 | 575 | -13,40 | ||||
| 2026-02-11 | 13F | J.Safra Asset Management Corp | 2.386 | 71 | ||||||
| 2026-01-26 | 13F | Private Trust Co Na | 189 | 0,00 | 6 | 0,00 | ||||
| 2026-02-17 | 13F | Nearwater Capital Markets, Ltd | 180.300 | 0,00 | 5.373 | -1,43 | ||||
| 2026-01-30 | 13F | Valued Wealth Advisors LLC | 528 | 0,00 | 16 | 0,00 | ||||
| 2026-02-13 | 13F | Causeway Capital Management Llc | 477.060 | 7,29 | 14.216 | 5,76 | ||||
| 2026-01-30 | 13F/A | M&t Bank Corp | 318.884 | 33,25 | 9.503 | 31,37 | ||||
| 2026-02-13 | 13F | Marshall Wace, Llp | 2.945.850 | 11,07 | 87.786 | 9,49 | ||||
| 2026-01-30 | 13F | Catalytic Wealth RIA, LLC | 21.959 | 16,92 | 654 | 15,34 | ||||
| 2026-02-13 | 13F | Sei Investments Co | 3.270.143 | 50,66 | 97.450 | 48,52 | ||||
| 2026-02-17 | 13F | DV Trading LLC | 1.000 | 30 | ||||||
| 2026-02-12 | 13F | Sustainable Insight Capital Management, LLC | 10.835 | 18,61 | 323 | 16,67 | ||||
| 2025-10-29 | 13F | Triasima Portfolio Management inc. | 0 | -100,00 | 0 | -100,00 | ||||
| 2026-02-17 | 13F | Qube Research & Technologies Ltd | 2.222.699 | 67,09 | 66.236 | 64,72 | ||||
| 2026-02-13 | 13F | Storgate, LLC | 15.174 | 452 | ||||||
| 2026-02-13 | 13F | Macquarie Group Ltd | 0 | -100,00 | 0 | |||||
| 2026-04-14 | 13F | Perpetual Ltd | 106.248 | -90,73 | 2.752 | -91,95 | ||||
| 2025-11-14 | 13F | Flow Traders U.s. Llc | 0 | -100,00 | 0 | |||||
| 2026-02-17 | 13F | Voleon Capital Management Lp | 93.072 | -12,84 | 2.774 | -14,10 | ||||
| 2026-02-04 | 13F | Hallmark Capital Management Inc | 109 | 3 | ||||||
| 2026-02-11 | 13F | Capital Group Private Client Services, Inc. | 27.904 | -2,61 | 832 | -4,04 | ||||
| 2026-02-17 | 13F | Agf Management Ltd | 13.624 | -99,58 | 406 | -99,59 | ||||
| 2026-01-12 | 13F | Castleview Partners, Llc | 7.778 | 8,87 | 232 | 7,44 | ||||
| 2026-04-10 | 13F | Naviter Wealth, LLC | 55.081 | 6,75 | 1.427 | -7,22 | ||||
| 2026-01-28 | 13F | Geneos Wealth Management Inc. | 0 | -100,00 | 0 | -100,00 | ||||
| 2026-02-17 | 13F | Millennium Management Llc | 2.241.935 | -13,89 | 66.810 | -15,11 | ||||
| 2026-02-11 | 13F | United Financial Planning Group LLC | 329 | 10 | ||||||
| 2026-02-12 | 13F | Callan Family Office, LLC | 64.515 | 1.923 | ||||||
| 2026-02-17 | 13F | GAM Holding AG | 100.950 | 7,49 | 3.008 | 5,95 | ||||
| 2026-04-09 | 13F | Overbrook Management Corp | 0 | -100,00 | 0 | |||||
| 2026-04-20 | 13F | Banque Cantonale Vaudoise | 22.048 | -7,69 | 571 | -19,80 | ||||
| 2026-04-21 | 13F | Financial Consulate, Inc | 60 | 11,11 | 2 | 0,00 | ||||
| 2025-11-12 | 13F | NewSquare Capital LLC | 0 | -100,00 | 0 | |||||
| 2025-11-14 | 13F | Scientech Research LLC | 0 | -100,00 | 0 | -100,00 | ||||
| 2026-04-20 | 13F | Jfs Wealth Advisors, Llc | 2.253 | -18,66 | 58 | -29,27 | ||||
| 2026-02-10 | 13F | CIBC World Markets Inc. | 17.121 | 31,56 | 510 | 29,77 | ||||
| 2026-04-09 | 13F | Tompkins Financial Corp | 0 | -100,00 | 0 | |||||
| 2026-02-12 | 13F | DJE Kapital AG | 26.425 | -41,24 | 788 | -47,57 | ||||
| 2025-11-10 | 13F | Dakota Wealth Management | 0 | -100,00 | 0 | |||||
| 2026-04-15 | 13F | Riversedge Advisors, Llc | 0 | -100,00 | 0 | |||||
| 2026-02-02 | 13F | Principal Financial Group Inc | 1.768.169 | -2,94 | 52.691 | -4,32 | ||||
| 2026-02-12 | 13F | Skopos Labs, Inc. | 49.342 | 72,45 | 1.472 | 51,81 | ||||
| 2026-02-19 | 13F | CI Private Wealth, LLC | 104.424 | 7,86 | 3.109 | 6,22 | ||||
| 2026-02-09 | 13F | Coldstream Capital Management Inc | 58.493 | -25,86 | 1.743 | -26,92 | ||||
| 2026-04-07 | 13F | Park Avenue Securities Llc | 49.176 | -11,29 | 1 | 0,00 | ||||
| 2026-02-17 | 13F | Dv Equities, Llc | 400 | 12 | ||||||
| 2026-02-18 | 13F | GWM Advisors LLC | 21.318 | -5,16 | 635 | -6,48 | ||||
| 2026-04-24 | 13F | Carmel Capital Management L.L.C. | 211.000 | 5.465 | ||||||
| 2026-02-13 | 13F | FORA Capital, LLC | 124.022 | 162,86 | 3.696 | 159,12 | ||||
| 2026-02-02 | 13F | Equitable Trust Co | 88.088 | -0,58 | 2.625 | -1,98 | ||||
| 2026-02-03 | 13F | Ballentine Partners, LLC | 12.552 | 5,58 | 374 | 4,18 | ||||
| 2026-04-24 | 13F | TT International Asset Management LTD | 209.833 | -24,90 | 5.435 | 67.825,00 | ||||
| 2026-04-20 | 13F | North of South Capital LLP | 8.439.972 | 14,23 | 218.595 | -0,72 | ||||
| 2026-02-17 | 13F | Ancora Advisors, LLC | 5.594 | 1,71 | 167 | 0,00 | ||||
| 2026-02-12 | 13F | Dimensional Fund Advisors Lp | 11.733.336 | 1,17 | 349.660 | -0,27 | ||||
| 2026-02-13 | 13F | Umb Bank N A/mo | 5.375 | 11,38 | 160 | 10,34 | ||||
| 2026-02-17 | 13F | Two Sigma Securities, Llc | 0 | -100,00 | 0 | -100,00 | ||||
| 2026-02-13 | 13F | Bank Of Nova Scotia | 16.831 | 0,00 | 502 | -1,38 | ||||
| 2026-04-20 | 13F | White Oak Capital Partners Pte. Ltd. | 4.782.824 | -10,40 | 121.598 | -23,64 | ||||
| 2026-02-05 | 13F | May Hill Capital, LLC | 7.828 | -24,31 | 233 | -25,32 | ||||
| 2026-02-13 | 13F | Resources Investment Advisors, LLC. | 29.137 | -4,78 | 868 | -6,16 | ||||
| 2026-02-17 | 13F | Bayesian Capital Management, LP | 0 | -100,00 | 0 | |||||
| 2026-04-16 | 13F | E. Ohman J:or Asset Management AB | 1.256.149 | 8,65 | 32.534 | -5,57 | ||||
| 2026-04-21 | 13F | Vise Technologies, Inc. | 198.241 | 0,00 | 5.908 | 0,00 | ||||
| 2026-04-23 | 13F | Ameliora Wealth Management Ltd. | 1.000 | -63,64 | 26 | -69,14 | ||||
| 2025-11-14 | 13F | Wetherby Asset Management Inc | 130.430 | 0,94 | 3.943 | -9,30 | ||||
| 2026-04-02 | 13F | Ares Financial Consulting, LLC | 86 | 0,00 | 2 | 0,00 | ||||
| 2026-04-24 | 13F | Merited Wealth, LLC | 0 | -100,00 | 0 | |||||
| 2026-02-13 | 13F | Manufacturers Life Insurance Company, The | 0 | -100,00 | 0 | |||||
| 2026-02-12 | 13F | Loomis Sayles & Co L P | 320.073 | -17,93 | 9.538 | -19,09 | ||||
| 2026-02-13 | 13F | MAI Capital Management | 713 | -30,84 | 21 | -32,26 | ||||
| 2026-04-24 | 13F | Keybank National Association/oh | 19.949 | 76,34 | 517 | 53,12 | ||||
| 2026-02-13 | 13F | Blueshift Asset Management, LLC | 26.414 | 31,22 | 787 | 29,44 | ||||
| 2025-11-13 | 13F | Quantitative Investment Management, LLC | 0 | -100,00 | 0 | |||||
| 2026-02-17 | 13F | FACT Capital, LP | 431.346 | -14,69 | 12.854 | -15,90 | ||||
| 2026-02-13 | 13F | Walleye Capital LLC | 9.557 | 285 | ||||||
| 2026-02-17 | 13F | Alliancebernstein L.p. | 166.724 | 375,57 | 4.968 | 369,12 | ||||
| 2025-11-13 | 13F | Capital Fund Management S.a. | 0 | -100,00 | 0 | -100,00 | ||||
| 2026-02-10 | 13F | NS Partners Ltd | 38.800 | -88,16 | 1.156 | -88,33 | ||||
| 2026-02-05 | 13F | Allworth Financial LP | 2.595 | 2,94 | 77 | 1,32 | ||||
| 2025-11-13 | 13F | Capital Fund Management S.a. | Call | 0 | -100,00 | 0 | -100,00 | |||
| 2026-02-11 | 13F | Capital International Investors | 13.070.452 | -35,65 | 389.516 | -36,56 | ||||
| 2026-02-13 | 13F | Walleye Capital LLC | Call | 15.400 | 459 | |||||
| 2026-02-13 | 13F | Walleye Capital LLC | Put | 30.300 | 903 | |||||
| 2026-02-12 | 13F | Qtron Investments LLC | 0 | -100,00 | 0 | |||||
| 2026-02-17 | 13F | Citadel Advisors Llc | 2.920.105 | 677,30 | 87.019 | 666,28 | ||||
| 2026-02-17 | 13F | Citadel Advisors Llc | Put | 140.100 | 47,47 | 4.175 | 45,38 | |||
| 2026-02-17 | 13F | Citadel Advisors Llc | Call | 98.100 | -50,75 | 2.923 | -51,45 | |||
| 2026-04-14 | 13F | Nbc Securities, Inc. | 872 | -0,23 | 23 | -15,38 | ||||
| 2026-04-10 | 13F | Henry James International Management Inc. | 138.811 | -2,14 | 3.595 | -14,95 | ||||
| 2026-02-05 | 13F | Td Private Client Wealth Llc | 992 | 35,89 | 30 | 31,82 | ||||
| 2026-02-12 | 13F | Federated Hermes, Inc. | 69.277 | -47,17 | 2.064 | -47,93 | ||||
| 2026-02-17 | 13F | Bamco Inc /ny/ | 0 | -100,00 | 0 | |||||
| 2026-02-10 | 13F | EagleClaw Capital Managment, LLC | 19.250 | 0,00 | 574 | -1,38 | ||||
| 2026-02-17 | 13F | MIRAE ASSET GLOBAL ETFS HOLDINGS Ltd. | 349.848 | 11,55 | 10.425 | 9,97 | ||||
| 2026-01-29 | 13F | Sanctuary Advisors, LLC | 45.106 | -3,49 | 1.344 | -4,82 | ||||
| 2026-01-30 | 13F | R Squared Ltd | 33.679 | 136,11 | 1.004 | 132,71 | ||||
| 2026-02-11 | 13F | Prudential Plc | 725.100 | 7,25 | 21.644 | 5,90 | ||||
| 2026-02-13 | 13F | Rhumbline Advisers | 394.992 | -4,24 | 11.771 | -5,61 | ||||
| 2026-02-11 | 13F | Capital Wealth Planning, LLC | 198.300 | -45,45 | 5.947 | -45,89 | ||||
| 2026-02-17 | 13F | Quantinno Capital Management LP | 311.544 | 52,56 | 9.284 | 50,40 | ||||
| 2026-01-27 | 13F | TD Waterhouse Canada Inc. | 3.086 | 2,25 | 92 | -1,09 | ||||
| 2026-02-17 | 13F | EFG International AG | 823.406 | 24.558 | ||||||
| 2026-02-11 | 13F | Deutsche Bank Ag\ | 5.917.302 | 105,98 | 176.336 | 103,05 | ||||
| 2026-01-29 | 13F | IMC-Chicago, LLC | 16.353 | -37,36 | 487 | -38,28 | ||||
| 2026-02-17 | 13F | Harding Loevner Lp | 299.318 | 295,77 | 8.920 | 290,16 | ||||
| 2026-01-27 | 13F | WealthCollab, LLC | 2.958 | -5,04 | 88 | -6,38 | ||||
| 2026-01-29 | 13F | IMC-Chicago, LLC | Put | 49.500 | 27,25 | 1.475 | 25,53 | |||
| 2026-02-13 | 13F | Smartleaf Asset Management LLC | 7.031 | 3,64 | 210 | 1,95 | ||||
| 2026-02-13 | 13F | Acumen Wealth Advisors, LLC | 310 | 9 | ||||||
| 2026-01-29 | 13F | IMC-Chicago, LLC | Call | 49.000 | -47,31 | 1.460 | -48,06 | |||
| 2026-04-13 | 13F | Augustine Asset Management Inc | 371.263 | 0,22 | 9.616 | -12,90 | ||||
| 2026-02-04 | 13F | LRI Investments, LLC | 125 | 0,00 | 4 | 0,00 | ||||
| 2026-02-12 | 13F | Quadrant Capital Group Llc | 25.072 | -2,38 | 747 | -3,74 | ||||
| 2026-02-17 | 13F | Two Sigma Advisers, Lp | 1.234.000 | 10.357,63 | 36.773 | 10.229,49 | ||||
| 2026-02-03 | 13F | Manning & Napier Advisors Llc | 0 | -100,00 | 0 | |||||
| 2026-02-11 | 13F | O'shaughnessy Asset Management, Llc | 248.199 | -3,83 | 7.396 | -5,20 | ||||
| 2026-01-29 | 13F | Coronation Fund Managers Ltd. | 8.075 | 8,94 | 241 | 7,14 | ||||
| 2026-02-10 | 13F | FDx Advisors, Inc. | 0 | -100,00 | 0 | |||||
| 2025-11-14 | 13F | Wolverine Trading, Llc | 10.206 | -49,46 | 309 | -54,76 | ||||
| 2026-01-23 | 13F | LOM Asset Management Ltd | 1.600 | 0,00 | 48 | -2,08 | ||||
| 2026-02-02 | 13F | Core Alternative Capital | 400 | 0,00 | 12 | -8,33 | ||||
| 2025-11-14 | 13F | Wolverine Trading, Llc | Call | 48.800 | -6,15 | 1.479 | -16,01 | |||
| 2026-02-09 | 13F | Knights of Columbus Asset Advisors LLC | 6.737 | 0,00 | 201 | -1,48 | ||||
| 2026-03-20 | 13F/A | Hsbc Holdings Plc | Call | 51.000 | 0,20 | 1.518 | -1,11 | |||
| 2026-02-17 | 13F/A | Northwest & Ethical Investments L.P. | 117.250 | -6,76 | 3.494 | -8,08 | ||||
| 2026-03-20 | 13F/A | Hsbc Holdings Plc | 3.607.553 | -45,78 | 111.214 | -45,61 | ||||
| 2026-02-02 | 13F | Benjamin Edwards Inc | 12.511 | 34,57 | 373 | 32,38 | ||||
| 2026-01-27 | 13F | Asset Management One Co., Ltd. | 142.443 | 0,00 | 4.249 | -1,32 | ||||
| 2026-03-20 | 13F/A | Hsbc Holdings Plc | Put | 47.800 | 214,47 | 1.423 | 210,48 | |||
| 2026-02-13 | 13F | Charles-Lim Capital Ltd | 1.625.000 | -27,78 | 48.425 | -28,80 | ||||
| 2026-02-12 | 13F | Integrated Quantitative Investments LLC | 0 | -100,00 | 0 | -100,00 | ||||
| 2026-02-12 | 13F | CIBC Private Wealth Group, LLC | 3.416 | -3,37 | 102 | -4,72 | ||||
| 2026-02-11 | 13F | Axiom International Investors Llc /de | 1.840.970 | -63,75 | 54.861 | -64,26 | ||||
| 2026-02-09 | 13F | Fisher Asset Management, LLC | 1.783.698 | 16,21 | 53.154 | 14,56 | ||||
| 2026-02-10 | 13F | Connor, Clark & Lunn Investment Management Ltd. | 3.150.236 | 8,05 | 93.877 | 6,52 | ||||
| 2026-01-26 | 13F | Moran Wealth Management, LLC | 153.800 | 11,56 | 4.583 | 9,98 | ||||
| 2026-02-17 | 13F | Delaware Management Holdings, Inc. | 179.191 | 5.339 | ||||||
| 2026-02-12 | 13F | Nuveen, LLC | 34.473 | -3,69 | 1.027 | -5,00 | ||||
| 2026-02-12 | 13F | Hrt Financial Lp | 399.154 | 83,40 | 12 | 83,33 | ||||
| 2026-04-07 | 13F | Signaturefd, Llc | 47.812 | -0,06 | 1.238 | -13,12 | ||||
| 2026-02-09 | 13F | Endowment Wealth Management, Inc. | 0 | -100,00 | 0 | |||||
| 2026-01-26 | 13F | Haven Global Partners, LLC | 640.656 | 13,90 | 19.092 | 12,27 | ||||
| 2026-01-27 | 13F | First Horizon Corp | 2.273 | 1,84 | 68 | 0,00 | ||||
| 2026-02-06 | 13F | Envestnet Portfolio Solutions, Inc. | 44.851 | -6,04 | 1.337 | -7,35 | ||||
| 2026-03-04 | 13F | Rehmann Capital Advisory Group | 8.692 | -4,80 | 259 | -6,16 | ||||
| 2026-02-17 | 13F | Ameriprise Financial Inc | 2.888.945 | -15,53 | 86.091 | -16,73 | ||||
| 2026-02-17 | 13F | D. E. Shaw & Co., Inc. | 5.920.209 | 21.119,39 | 176.422 | 20.827,88 | ||||
| 2026-02-12 | 13F | Earnest Partners Llc | 4.518.979 | 9,80 | 134.666 | 8,23 | ||||
| 2026-02-24 | 13F | DGS Capital Management, LLC | 9.016 | -17,23 | 269 | -18,54 | ||||
| 2026-04-23 | 13F | Lansforsakringar Fondforvaltning AB (publ) | 9.845 | -77,68 | 255 | -80,67 | ||||
| 2026-04-08 | 13F | DiNuzzo Private Wealth, Inc. | 550 | 0,00 | 14 | -12,50 | ||||
| 2026-04-06 | 13F | Versant Capital Management, Inc | 168 | 15,86 | 4 | 0,00 | ||||
| 2026-02-13 | 13F | Capula Management Ltd | 0 | -100,00 | 0 | |||||
| 2026-01-22 | 13F | Personal Cfo Solutions, Llc | 30.772 | 2,09 | 917 | 0,55 | ||||
| 2026-02-13 | 13F | Barclays Plc | 386.815 | 2,39 | 11.527 | 0,94 | ||||
| 2026-02-12 | 13F | Dsm Capital Partners Llc | 179.445 | -17,14 | 5.347 | -18,33 | ||||
| 2026-02-17 | 13F | Susquehanna International Group, Llp | Call | 120.000 | -66,80 | 3.576 | -67,28 | |||
| 2026-02-06 | 13F | Milestone Resources Group Ltd | 7.890.422 | 0,00 | 235 | -1,26 | ||||
| 2026-02-17 | 13F | Susquehanna International Group, Llp | 127.615 | -42,89 | 3.803 | -43,71 | ||||
| 2026-02-04 | 13F | C WorldWide Group Holding A/S | 1.992.068 | -17,28 | 59 | -18,06 | ||||
| 2026-02-13 | 13F | Glen Eagle Advisors, LLC | 2.300 | 0,00 | 69 | -1,45 | ||||
| 2026-02-17 | 13F | Susquehanna International Group, Llp | Put | 72.900 | 57,11 | 2.172 | 54,92 | |||
| 2026-04-13 | 13F | Highland Capital Management, Llc | 28.850 | -0,17 | 747 | -13,24 | ||||
| 2026-01-16 | 13F | Empirical Financial Services, LLC d.b.a. Empirical Wealth Management | 18.102 | 44,54 | 539 | 42,59 | ||||
| 2026-04-20 | 13F | Ritholtz Wealth Management | 42.766 | -11,63 | 1.108 | -23,23 | ||||
| 2026-02-13 | 13F | Pinpoint Asset Management (Singapore) Pte. Ltd. | 0 | -100,00 | 0 | |||||
| 2026-02-12 | 13F | XY Capital Ltd | 36.193 | -54,36 | 1.079 | -55,03 | ||||
| 2026-01-29 | 13F | Calamos Advisors LLC | 0 | -100,00 | 0 | |||||
| 2026-02-06 | 13F | Americana Partners, LLC | 16.341 | -4,14 | 487 | -5,63 | ||||
| 2026-02-11 | 13F | Buckingham Strategic Partners | 26.772 | -11,72 | 798 | -13,09 | ||||
| 2026-02-13 | 13F | Mariner, LLC | 94.021 | -0,19 | 2.804 | -1,55 | ||||
| 2026-02-02 | 13F | Your Advocates Ltd., LLP | 30 | 0,00 | 1 | |||||
| 2026-02-13 | 13F | Cloverfields Capital Group, Lp | 45.368 | 1,41 | 1.352 | -0,07 | ||||
| 2026-02-13 | 13F | Toroso Investments, LLC | 256.574 | -1,16 | 7.646 | -2,57 | ||||
| 2026-04-22 | 13F | Border to Coast Pensions Partnership Ltd | 877.715 | 12,50 | 23 | -4,35 | ||||
| 2026-02-17 | 13F | LMR Partners LLP | 2.666.414 | 431,44 | 79.459 | 423,89 | ||||
| 2026-02-04 | 13F | Tsfg, Llc | 1.800 | 0,00 | 0 | |||||
| 2026-02-11 | 13F | OPTIMAS CAPITAL Ltd | 55.000 | 1.639 | ||||||
| 2026-04-20 | 13F | Assenagon Asset Management S.A. | 1.146.817 | -5,68 | 29.703 | -18,02 | ||||
| 2026-02-11 | 13F | Fox Run Management, L.l.c. | 12.790 | -27,89 | 381 | -28,92 | ||||
| 2026-02-13 | 13F | Neuberger Berman Group LLC | 498.364 | -6,13 | 14.854 | -7,48 | ||||
| 2025-11-14 | 13F | Moors & Cabot, Inc. | 0 | -100,00 | 0 | -100,00 | ||||
| 2026-04-24 | 13F | Ninety One North America, Inc. | 647.806 | 11,30 | 16.778 | -3,26 | ||||
| 2026-01-15 | 13F | Frank, Rimerman Advisors LLC | 86.915 | 0,00 | 2.590 | -1,41 | ||||
| 2026-02-17 | 13F | Royal Bank Of Canada | 1.325.420 | -83,42 | 39.499 | -83,65 | ||||
| 2026-02-17 | 13F | Graham Capital Management, L.P. | 35.129 | 1.047 | ||||||
| 2026-04-24 | 13F | Deprince Race & Zollo Inc | 462.784 | 25,77 | 11.986 | 9,32 | ||||
| 2026-02-12 | 13F | Ci Investments Inc. | 0 | -100,00 | 0 | -100,00 | ||||
| 2026-04-16 | 13F | Stanley-Laman Group, Ltd. | 0 | -100,00 | 0 | -100,00 | ||||
| 2026-02-11 | 13F | Letko, Brosseau & Associates Inc | 427.852 | -2,26 | 12.750 | -3,66 | ||||
| 2026-02-12 | 13F | Raiffeisen Bank International AG | 0 | -100,00 | 0 | |||||
| 2026-03-03 | 13F/A | Caitong International Asset Management Co., Ltd | 14.703 | 34.093,02 | 438 | 43.700,00 | ||||
| 2026-04-08 | 13F | Legacy Wealth Asset Management, LLC | 71.503 | -1,80 | 1.852 | -14,66 | ||||
| 2026-04-08 | 13F | Seed Wealth Management, Inc. | 21.030 | -0,02 | 545 | -13,10 | ||||
| 2026-02-11 | 13F | West Family Investments, Inc. | 52.750 | -3,34 | 1.572 | -4,73 | ||||
| 2026-02-11 | 13F | BI Asset Management Fondsmaeglerselskab A/S | 0 | -100,00 | 0 | |||||
| 2026-02-12 | 13F | Brown Brothers Harriman & Co | 2.432 | 32,32 | 72 | 30,91 | ||||
| 2026-02-14 | 13F | Militia Capital Partners, LP | 7.000 | 209 | ||||||
| 2026-02-17 | 13F | Summit Trail Advisors, Llc | 0 | -100,00 | 0 | |||||
| 2025-11-20 | 13F | First Affirmative Financial Network | 11.304 | 1,55 | 342 | -8,82 | ||||
| 2026-01-29 | 13F | Matthews International Capital Management Llc | 369.492 | -0,08 | 11.011 | -1,50 | ||||
| 2026-01-29 | 13F | Vanguard Group Inc | 960.233 | -1,85 | 28.615 | -3,25 | ||||
| 2026-02-12 | 13F | Polen Capital Management Llc | 0 | -100,00 | 0 | |||||
| 2026-02-04 | 13F | Ameritas Advisory Services, LLC | 0 | -100,00 | 0 | |||||
| 2026-03-03 | 13F/A | Ovata Capital Management Ltd | 144.100 | 4.306 | ||||||
| 2026-02-14 | 13F | Rockefeller Capital Management L.P. | 2.386.011 | -22,47 | 71.103 | -23,57 | ||||
| 2026-03-12 | 13F/A | Peak6 Llc | Put | 27.400 | -41,45 | 817 | -42,29 | |||
| 2026-03-12 | 13F/A | Peak6 Llc | Call | 55.000 | 547,06 | 1.639 | 540,23 | |||
| 2026-01-29 | 13F | Calamos Wealth Management LLC | 0 | -100,00 | 0 | |||||
| 2026-03-12 | 13F/A | Peak6 Llc | 11.544 | -11,32 | 344 | -12,47 | ||||
| 2025-11-07 | 13F | Pzena Investment Management Llc | 0 | -100,00 | 0 | -100,00 | ||||
| 2026-04-22 | 13F | Janney Montgomery Scott LLC | 33.856 | 21,59 | 1 | |||||
| 2026-01-28 | 13F | B. Metzler seel. Sohn & Co. AG | 54.869 | 5,05 | 1.635 | 3,61 | ||||
| 2026-02-13 | 13F | Cornerstone Financial Management LLC | 406 | 12 | ||||||
| 2026-02-17 | 13F | Man Group plc | 9.070.256 | 34,60 | 270.294 | 32,68 | ||||
| 2026-02-11 | 13F | Capital International Ltd /ca/ | 364.069 | -16,91 | 10.849 | -18,09 | ||||
| 2026-02-12 | 13F | Alps Advisors Inc | 835.000 | 0,00 | 24.883 | -1,42 | ||||
| 2026-02-18 | 13F | Guardian Capital Lp | 478.281 | 1,81 | 14.253 | 0,36 | ||||
| 2026-02-13 | 13F | SRS Capital Advisors, Inc. | 16.823 | 92,20 | 501 | 89,77 | ||||
| 2026-04-15 | 13F | Cranbrook Wealth Management, LLC | 53 | 0,00 | 1 | 0,00 | ||||
| 2026-02-18 | 13F | Mackenzie Financial Corp | 1.220.907 | -12,31 | 36.372 | -13,58 | ||||
| 2026-01-29 | 13F | D.a. Davidson & Co. | 7.847 | -0,95 | 234 | -2,51 | ||||
| 2026-02-17 | 13F | Guggenheim Capital Llc | 50.359 | 5,07 | 1.501 | 3,59 | ||||
| 2025-11-14 | 13F | Parallax Volatility Advisers, L.P. | Call | 0 | -100,00 | 0 | -100,00 | |||
| 2026-02-11 | 13F | Longfellow Investment Management Co Llc | 81.992 | -5,27 | 2.443 | -6,61 | ||||
| 2026-04-16 | 13F | CogentBlue Wealth Advisors, LLC | 18.049 | -12,16 | 467 | -23,69 | ||||
| 2026-04-21 | 13F | Robeco Institutional Asset Management B.V. | 19.838.697 | 6,20 | 513.822 | -7,70 | ||||
| 2026-02-14 | 13F | Frec Markets, Inc. | 8.669 | 258 | ||||||
| 2026-02-17 | 13F | Creative Planning | 42.372 | -17,93 | 1.263 | -19,10 | ||||
| 2026-02-17 | 13F | Edmond De Rothschild Holding S.a. | 890.335 | 6,86 | 26.532 | 5,34 | ||||
| 2025-11-07 | 13F | Beacon Capital Management, LLC | 0 | -100,00 | 0 | |||||
| 2026-02-10 | 13F | State of Wyoming | 25.342 | -2,58 | 755 | -3,94 | ||||
| 2026-04-14 | 13F | Clean Yield Group | 244 | 0,00 | 6 | -14,29 | ||||
| 2026-02-13 | 13F | Aigen Investment Management, Lp | 0 | -100,00 | 0 | |||||
| 2025-11-14 | 13F | Point72 Hong Kong Ltd | 0 | -100,00 | 0 | -100,00 | ||||
| 2026-02-06 | 13F | Carrhae Capital LLP | 1.992.766 | -50,21 | 59.384 | -50,92 | ||||
| 2026-04-24 | 13F | Yousif Capital Management, Llc | 18.744 | -31,69 | 485 | -40,05 | ||||
| 2026-02-09 | 13F | Geode Capital Management, Llc | 16.170 | -6,42 | 482 | -7,85 | ||||
| 2026-02-13 | 13F | Bridgefront Capital, LLC | 21.346 | 636 | ||||||
| 2026-02-17 | 13F | Advisor Group Holdings, Inc. | 40.551 | -38,25 | 1.209 | -39,24 | ||||
| 2026-01-08 | 13F | Tuttle Tactical Management LLC | 14.569 | 434 | ||||||
| 2026-02-10 | 13F | Operose Advisors LLC | 0 | -100,00 | 0 | -100,00 | ||||
| 2026-02-17 | 13F | Principal Street Partners, LLC | 7.600 | -3,92 | 226 | -5,44 | ||||
| 2026-02-17 | 13F | Price T Rowe Associates Inc /md/ | 6.774.963 | 0,33 | 202 | -1,47 | ||||
| 2026-02-03 | 13F | Garner Asset Management Corp | 3.942 | 117 | ||||||
| 2026-02-10 | 13F | Goldman Sachs Group Inc | 9.638.869 | 52,09 | 287.238 | 49,92 | ||||
| 2026-02-17 | 13F | Shelton Capital Management | 15.723 | -14,19 | 469 | -15,37 | ||||
| 2026-02-10 | 13F | Goldman Sachs Group Inc | Call | 120.000 | 0,00 | 3.576 | -1,41 | |||
| 2026-04-06 | 13F | Rosenberg Matthew Hamilton | 9.633 | 0,00 | 249 | -13,24 | ||||
| 2026-02-17 | 13F | Amundi | 1.073.325 | -1,73 | 31.985 | -4,74 | ||||
| 2026-02-12 | 13F | Barings Llc | 10.724 | 7,63 | 320 | 5,98 | ||||
| 2026-02-10 | 13F | Daiwa Securities Group Inc. | 4.862.631 | 4,66 | 145 | -21,74 | ||||
| 2026-02-09 | 13F | Employees Retirement System of Texas | 139.859 | -47,61 | 4 | -50,00 | ||||
| 2026-02-19 | 13F | Invesco Ltd. | 21.643.517 | -7,54 | 644.977 | -8,85 | ||||
| 2026-02-17 | 13F | Tower Research Capital LLC (TRC) | 300 | -93,94 | 9 | -94,63 | ||||
| 2025-11-06 | 13F | Mitchell Capital Management Co | 0 | -100,00 | 0 | |||||
| 2026-02-17 | 13F | Snowden Capital Advisors LLC | 43.606 | -3,30 | 1.299 | -4,70 | ||||
| 2026-02-17 | 13F | Fred Alger Management, Llc | 20.633 | -94,33 | 615 | -94,42 | ||||
| 2026-02-06 | 13F | Handelsbanken Fonder AB | 67.467 | 19,66 | 2 | 100,00 | ||||
| 2026-02-02 | 13F | Pittenger & Anderson Inc | 148.345 | -0,20 | 4.421 | -1,62 | ||||
| 2026-01-20 | 13F | Sovran Advisors, LLC | 13.598 | 93,07 | 419 | 93,98 | ||||
| 2026-02-23 | 13F | Beaird Harris Wealth Management, LLC | 0 | -100,00 | 0 | |||||
| 2026-04-14 | 13F | BSW Wealth Partners | 31.853 | 13,04 | 825 | -1,79 | ||||
| 2026-02-10 | 13F | Fideuram Asset Management (Ireland) dac | 2.630 | 79 | ||||||
| 2026-02-12 | 13F | Hollencrest Capital Management | 0 | -100,00 | 0 | |||||
| 2026-04-07 | 13F | Farther Finance Advisors, LLC | 16.663 | 91,42 | 429 | 65,25 | ||||
| 2026-01-30 | 13F | Laurel Wealth Advisors LLC | 102 | 3 | ||||||
| 2026-02-17 | 13F | HighVista Strategies LLC | 26.284 | -29,05 | 783 | -30,03 | ||||
| 2026-01-15 | 13F | J. Safra Sarasin Holding AG | 0 | -100,00 | 0 | |||||
| 2026-02-09 | 13F | Choate Investment Advisors | 7.717 | 0,00 | 230 | -1,72 | ||||
| 2026-02-11 | 13F | Group One Trading, L.p. | Put | 89.100 | -7,67 | 2.655 | -8,98 | |||
| 2026-01-21 | 13F | Albion Financial Group /ut | 176 | 0,00 | 5 | 0,00 | ||||
| 2025-11-14 | 13F | Axa S.a. | 0 | -100,00 | 0 | |||||
| 2026-02-11 | 13F | Group One Trading, L.p. | Call | 101.600 | -9,20 | 3.028 | -10,50 | |||
| 2026-02-23 | 13F | Virtu Financial LLC | 54.705 | 92,49 | 2 | |||||
| 2026-02-17 | 13F | Herold Advisors, Inc. | 28.950 | 0,00 | 863 | -1,49 | ||||
| 2026-02-17 | 13F | Raymond James Financial Inc | 735.389 | 4,63 | 21.915 | 3,14 | ||||
| 2026-02-09 | 13F | Main Street Research LLC | 1.022.131 | -2,83 | 30.460 | -4,21 | ||||
| 2026-02-10 | 13F | Bruce G. Allen Investments, LLC | 1.466 | -6,27 | 44 | -8,51 | ||||
| 2025-11-04 | 13F | Veritas Asset Management LLP | 0 | -100,00 | 0 | -100,00 | ||||
| 2025-11-05 | 13F | First National Bank of Hutchinson | 0 | -100,00 | 0 | |||||
| 2026-04-15 | 13F | Fortitude Family Office, LLC | 222 | 0,00 | 6 | -16,67 | ||||
| 2025-10-31 | 13F | Whittier Trust Co | 0 | -100,00 | 0 | -100,00 | ||||
| 2026-02-09 | 13F | William Blair Investment Management, Llc | 1.605.841 | -15,37 | 47.840 | -16,59 | ||||
| 2026-04-23 | 13F | North Star Investment Management Corp. | 164 | 4 | ||||||
| 2026-04-23 | 13F | McMillan Office, Inc. | 1.650 | 0,00 | 43 | -14,29 | ||||
| 2026-02-03 | 13F | Ethic Inc. | 281.291 | 1,77 | 8.382 | 0,32 | ||||
| 2026-02-11 | 13F | Capital International Sarl | 403.334 | -17,87 | 12.019 | -19,04 | ||||
| 2026-02-17 | 13F | Glenmede Trust Co Na | 57.668 | -4,52 | 1.719 | -9,72 | ||||
| 2026-02-10 | 13F | Bank of New York Mellon Corp | 575.611 | -36,98 | 17.153 | -37,88 | ||||
| 2026-01-26 | 13F | Asset Dedication, LLC | 1.092 | 0,00 | 33 | -3,03 | ||||
| 2026-02-12 | 13F | M&G Plc | 186.848 | 50,82 | 5.605 | 50,83 | ||||
| 2026-02-13 | 13F | Atlas Capital Advisors Llc | 1.319 | -13,22 | 39 | -23,53 | ||||
| 2025-11-10 | 13F | Cary Street Partners Financial Llc | 0 | -100,00 | 0 | |||||
| 2026-04-21 | 13F | Venturi Wealth Management, LLC | 18.602 | -21,01 | 482 | -31,38 | ||||
| 2026-01-29 | 13F | Sava Infond d.o.o. | 61.700 | 0,00 | 1.839 | -1,45 | ||||
| 2026-02-03 | 13F | Crestwood Advisors Group LLC | 10.092 | 301 | ||||||
| 2026-02-10 | 13F | Triglav Skladi, D.o.o. | 81.379 | 28,41 | 2.425 | 26,63 | ||||
| 2026-02-12 | 13F | Brinker Capital Investments, LLC | 145.491 | 2,93 | 4.336 | 1,47 | ||||
| 2026-04-22 | 13F | ABN AMRO Bank N.V. | 26.000 | 0,00 | 676 | -12,32 | ||||
| 2026-02-13 | 13F | Gts Securities Llc | 102.623 | 43,17 | 3.058 | 41,18 | ||||
| 2026-02-09 | 13F | Cary Street Partner Investment Advisory Llc | 0 | -100,00 | 0 | |||||
| 2026-02-12 | 13F | Commonwealth Equity Services, Llc | 16.128 | 13,61 | 481 | |||||
| 2026-02-17 | 13F | SageView Advisory Group, LLC | 758 | 23 | ||||||
| 2026-04-20 | 13F | Ronald Blue Trust, Inc. | 48.630 | -8,41 | 1.260 | -20,42 | ||||
| 2026-02-11 | 13F | LPL Financial LLC | 494.043 | 10,79 | 14.722 | 9,21 | ||||
| 2026-04-14 | 13F | Banque Pictet & Cie Sa | 110.397 | 2,71 | 2.859 | -10,74 | ||||
| 2026-02-04 | 13F | Aubrey Capital Management Ltd | 8.600 | -98,04 | 256 | -98,07 | ||||
| 2026-02-13 | 13F | JustInvest LLC | 281.752 | 11,51 | 8.396 | 9,92 | ||||
| 2026-01-30 | 13F | Bogart Wealth, LLC | 11 | -90,35 | 0 | -100,00 | ||||
| 2026-02-11 | 13F | Syon Capital Llc | 9.433 | 281 | ||||||
| 2026-01-14 | 13F | ORG Wealth Partners, LLC | 717 | 0,00 | 21 | 0,00 | ||||
| 2026-02-03 | 13F | Mitsubishi UFJ Kokusai Asset Management Co., Ltd. | 0 | -100,00 | 0 | |||||
| 2026-02-10 | 13F | Jupiter Asset Management Ltd | 73.045 | -65,54 | 2.177 | -66,04 | ||||
| 2026-01-30 | 13F | Amansa Capital Pte. Ltd. | 5.000.000 | -16,67 | 149.000 | -17,85 | ||||
| 2026-02-09 | 13F | Hantz Financial Services, Inc. | 67.544 | 12,01 | 2 | 100,00 | ||||
| 2025-11-04 | 13F/A | Lingohr & Partner Asset Management GmbH | 48.000 | 1 | ||||||
| 2026-02-17 | 13F | Fmr Llc | 2.262.454 | -1,00 | 67.421 | -2,41 | ||||
| 2026-04-20 | 13F | Foster Victor Wealth Advisors, LLC | 18.380 | 32,47 | 520 | 21,26 | ||||
| 2025-11-07 | 13F | Sierra Ocean, Llc | 0 | -100,00 | 0 | |||||
| 2026-02-13 | 13F | Templeton & Phillips Capital Management, LLC | 0 | -100,00 | 0 | |||||
| 2026-02-13 | 13F | Dai-Ichi Life Insurance Company, Ltd | 16.400 | 0,00 | 489 | -1,41 | ||||
| 2026-04-21 | 13F | SmartHarvest Portfolios, LLC | 0 | -100,00 | 0 | |||||
| 2026-01-29 | 13F | Verdence Capital Advisors LLC | 20.498 | -1,69 | 611 | -6,01 | ||||
| 2026-02-12 | 13F | Xponance, Inc. | 11.271 | 5,55 | 336 | 4,04 | ||||
| 2026-02-17 | 13F | Opal Capital Llc | 29.760 | 887 | ||||||
| 2026-02-13 | 13F | Pinnacle Wealth Planning Services, Inc. | 20.074 | -0,18 | 598 | -1,48 | ||||
| 2026-02-13 | 13F | Corient IA LLC | 0 | -100,00 | 0 | |||||
| 2026-02-17 | 13F | Cetera Investment Advisers | 114.558 | 0,40 | 3.414 | -1,04 | ||||
| 2026-02-17 | 13F | Cresset Asset Management, LLC | 17.989 | 11,67 | 536 | 10,29 | ||||
| 2026-04-21 | 13F | GHP Investment Advisors, Inc. | 13.300 | 0,00 | 344 | -13,13 | ||||
| 2026-02-13 | 13F | State Street Corp | 8.345.467 | -1,29 | 248.695 | -2,70 | ||||
| 2026-02-06 | 13F | Cullen/frost Bankers, Inc. | 1.709 | 40,08 | 51 | 38,89 | ||||
| 2026-02-12 | 13F | Renaissance Technologies Llc | 0 | -100,00 | 0 | |||||
| 2026-02-06 | 13F | EverSource Wealth Advisors, LLC | 16.609 | 0,42 | 495 | -1,20 | ||||
| 2026-04-08 | 13F | High Point Wealth Management, LLC | 275 | 7 | ||||||
| 2026-02-12 | 13F | Custom Index Systems, Llc | 14.015 | 0,00 | 418 | -1,42 | ||||
| 2026-02-04 | 13F | Wsfs Capital Management, Llc | 10.085 | 6,71 | 301 | 5,26 | ||||
| 2025-10-30 | 13F | Twin Peaks Wealth Advisors, LLC | 0 | -100,00 | 0 | |||||
| 2026-02-13 | 13F | Motiv8 Investments LLC | 83 | 0 | ||||||
| 2026-02-18 | 13F | SkyView Investment Advisors, LLC | 21.746 | -0,79 | 1 | |||||
| 2026-04-24 | 13F | Ninety One UK Ltd | 9.651.781 | 3,36 | 249.981 | -10,17 | ||||
| 2026-02-13 | 13F | Black Creek Investment Management Inc. | 34.683 | -59,09 | 1.034 | -59,68 | ||||
| 2025-11-14 | 13F | PineBridge Investments, L.P. | 959.750 | -1,03 | 29.013 | -11,06 | ||||
| 2026-02-17 | 13F | FIL Ltd | 7.481.727 | -30,80 | 222.955 | -31,79 | ||||
| 2025-11-12 | 13F | Victory Capital Management Inc | 0 | -100,00 | 0 | |||||
| 2026-02-06 | 13F | Abn Amro Investment Solutions | 64.084 | -30,63 | 1.910 | -31,63 | ||||
| 2026-02-12 | 13F/A | Pinebridge Investments Llc | 12.850 | 383 | ||||||
| 2026-02-13 | 13F | Ieq Capital, Llc | 86.582 | -1,11 | 2.580 | -2,49 | ||||
| 2026-04-15 | 13F | Journey Strategic Wealth Llc | 8.132 | -5,45 | 211 | -17,97 | ||||
| 2025-11-04 | 13F | High Note Wealth, LLC | 0 | -100,00 | 0 | |||||
| 2026-02-03 | 13F | We Are One Seven, LLC | 7.493 | 223 | ||||||
| 2026-02-11 | 13F | Crestwood Capital Management, L.P. | 678.900 | 0,00 | 20.231 | -1,42 | ||||
| 2026-02-17 | 13F | Mercer Global Advisors Inc /adv | 26.139 | 3,30 | 779 | 1,83 | ||||
| 2025-11-13 | 13F | Riggs Asset Managment Co. Inc. | 0 | -100,00 | 0 | |||||
| 2026-04-24 | 13F | UMA Financial Services, Inc. | 20 | -87,34 | 1 | -100,00 | ||||
| 2026-02-06 | 13F | Alan B. Lancz & Associates, Inc. | 17.655 | 0,00 | 526 | -1,31 | ||||
| 2026-04-01 | 13F | Confluence Investment Management Llc | 10.957 | 3,36 | 284 | -10,16 | ||||
| 2025-10-30 | 13F | Jennison Associates Llc | 0 | -100,00 | 0 | |||||
| 2026-01-15 | 13F | BTC Capital Management, Inc. | 0 | -100,00 | 0 | |||||
| 2026-04-14 | 13F | Pictet & Cie (Europe) SA | 45.906 | -2,94 | 1.189 | -15,68 | ||||
| 2026-01-29 | 13F | Quest 10 Wealth Builders, Inc. | 0 | -100,00 | 0 | |||||
| 2026-01-28 | 13F | Oversea-Chinese Banking CORP Ltd | 345.647 | 128,61 | 10.295 | 125,27 | ||||
| 2026-02-13 | 13F | National Bank Of Canada /fi/ | 3.646.451 | -16,30 | 108.664 | -17,49 | ||||
| 2026-04-22 | 13F | Bravera Wealth | 0 | -100,00 | 0 | |||||
| 2025-10-28 | 13F | Richardson Financial Services Inc. | 0 | -100,00 | 0 | |||||
| 2026-02-12 | 13F | Cloud Capital Management, LLC | 0 | -100,00 | 0 | |||||
| 2026-02-05 | 13F | Center for Financial Planning, Inc. | 371 | 0,00 | 11 | 0,00 | ||||
| 2026-02-13 | 13F | Morgan Stanley | 53.772.858 | 7,98 | 1.602.431 | 6,45 | ||||
| 2026-04-16 | 13F | Diversified Trust Co | 0 | -100,00 | 0 | -100,00 | ||||
| 2026-04-17 | 13F | AdvisorNet Financial, Inc | 466 | -26,50 | 12 | -33,33 | ||||
| 2026-02-14 | 13F | Whipplewood Advisors, LLC | 125 | 4 | ||||||
| 2026-02-12 | 13F | Advisors Asset Management, Inc. | 0 | -100,00 | 0 | |||||
| 2026-02-13 | 13F | Strategic Global Advisors, LLC | 13.660 | 38,26 | 407 | 36,58 | ||||
| 2026-01-15 | 13F | Nisa Investment Advisors, Llc | 229 | 7 | ||||||
| 2026-02-06 | 13F | Larson Financial Group LLC | 831 | 855,17 | 25 | 1.100,00 | ||||
| 2025-11-14 | 13F | Oxbow Capital Management (HK) Ltd | 0 | -100,00 | 0 | |||||
| 2025-11-14 | 13F | EFG Asset Management (Americas) Corp. | 46.922 | 0,29 | 1.418 | -9,85 | ||||
| 2026-02-11 | 13F | Allianz Asset Management GmbH | 479.312 | -34,91 | 14.283 | -35,84 | ||||
| 2026-02-12 | 13F | Douglass Winthrop Advisors, LLC | 10.862 | -0,06 | 324 | -1,52 | ||||
| 2026-02-17 | 13F | Aquatic Capital Management LLC | 246.527 | 7.347 | ||||||
| 2026-02-02 | 13F | Fifth Third Bancorp | 1.366 | 4,51 | 41 | 2,56 | ||||
| 2026-02-17 | 13F | Cape Investment Advisory, Inc. | 216 | -0,46 | 6 | 0,00 | ||||
| 2026-02-17 | 13F | Credit Agricole S A | 646.829 | 118,77 | 19.276 | 115,65 | ||||
| 2026-04-17 | 13F | Murphy & Mullick Capital Management Corp | 2.530 | 0,00 | 66 | -13,33 | ||||
| 2026-01-16 | 13F | Crewe Advisors LLC | 118 | 32,58 | 4 | 50,00 | ||||
| 2026-02-10 | 13F | Quantbot Technologies LP | 64.354 | 1.918 | ||||||
| 2025-11-12 | 13F | Accuvest Global Advisors | 0 | -100,00 | 0 | |||||
| 2025-11-13 | 13F | Change Path, LLC | 0 | -100,00 | 0 | |||||
| 2026-02-12 | 13F | Wealthspire Advisors, LLC | 0 | -100,00 | 0 | |||||
| 2026-04-14 | 13F | Opal Wealth Advisors, LLC | 3.280 | 85 | ||||||
| 2026-02-13 | 13F | Cullen Capital Management, LLC | 1.747.387 | 1,02 | 52.072 | -0,42 | ||||
| 2026-02-17 | 13F | Quadrature Capital Ltd | 333.495 | 9.938 | ||||||
| 2026-02-13 | 13F | Squarepoint Ops LLC | 516.644 | 276,72 | 15.396 | 271,41 | ||||
| 2026-02-17 | 13F | Think Investments LP | 1.292.200 | 0,00 | 38.508 | -1,42 | ||||
| 2026-02-12 | 13F | Groupe la Francaise | 93.256 | 0,00 | 2.777 | -1,56 | ||||
| 2026-01-15 | 13F | Allspring Global Investments Holdings, LLC | 469.477 | 5,71 | 14.080 | 3,81 | ||||
| 2026-01-23 | 13F | Assetmark, Inc | 169.081 | 7,23 | 5.039 | 5,71 | ||||
| 2026-03-11 | 13F | Leonteq Securities AG | Put | 0 | -100,00 | 0 | -100,00 | |||
| 2026-04-08 | 13F | Grove Bank & Trust | 4.119 | -0,07 | 107 | -13,11 | ||||
| 2026-04-20 | 13F | TrueMark Investments, LLC | 80.381 | 170,10 | 2.082 | 134,88 | ||||
| 2026-02-12 | 13F | Scotia Capital Inc. | 375.208 | -24,54 | 11.181 | -25,61 | ||||
| 2026-02-10 | 13F | Bnp Paribas Arbitrage, Sa | 6.128.057 | -0,73 | 182.616 | -2,14 | ||||
| 2026-01-12 | 13F | VisionPoint Advisory Group, LLC | 62.252 | 6,26 | 1.855 | 4,80 | ||||
| 2026-02-18 | 13F | EP Wealth Advisors, Inc. | 20.476 | 106,14 | 610 | 82,63 | ||||
| 2026-02-10 | 13F | Acadian Asset Management Llc | 1.942.530 | -19,85 | 58 | -21,92 | ||||
| 2026-04-22 | 13F | Pictet Asset Management Holding SA | 3.294.052 | 17,71 | 85.316 | 2,30 | ||||
| 2026-02-11 | 13F | Parallel Advisors, LLC | 14.415 | -0,05 | 430 | -1,38 | ||||
| 2026-02-12 | 13F | DRW Securities, LLC | 139.436 | 1.998,99 | 4.155 | 1.967,16 | ||||
| 2026-02-13 | 13F | Verition Fund Management LLC | 74.877 | 49,27 | 2.231 | 47,16 | ||||
| 2026-04-22 | 13F | Samalin Investment Counsel, LLC | 9.798 | 2,89 | 254 | -10,60 | ||||
| 2026-02-05 | 13F | Mesirow Financial Investment Management, Inc. | 0 | -100,00 | 0 | |||||
| 2026-02-12 | 13F | Principal Securities, Inc. | 8.911 | -15,97 | 266 | -17,19 | ||||
| 2026-01-29 | 13F | Rakuten Securities, Inc. | 2.077 | 50,18 | 62 | 48,78 | ||||
| 2026-02-06 | 13F | Entrust Financial Llc | 1.657 | 49 | ||||||
| 2026-02-13 | 13F | Verition Fund Management LLC | Put | 28.800 | -58,02 | 858 | -58,61 | |||
| 2026-04-17 | 13F | CENTRAL TRUST Co | 33 | 0,00 | 1 | |||||
| 2026-01-30 | 13F | Us Bancorp \de\ | 354.965 | -0,78 | 10.578 | -2,19 | ||||
| 2026-02-17 | 13F | Aureus Asset Management, LLC | 15.940 | -0,31 | 475 | -1,66 | ||||
| 2026-01-27 | 13F | Brighton Jones Llc | 0 | -100,00 | 0 | |||||
| 2026-02-13 | 13F | Golden State Wealth Management, LLC | 22 | 0,00 | 1 | |||||
| 2026-04-08 | 13F | Dynamic Advisor Solutions LLC | 0 | -100,00 | 0 | |||||
| 2026-02-11 | 13F | Simplex Trading, Llc | 5.625 | -5,35 | 168 | |||||
| 2026-02-11 | 13F | Simplex Trading, Llc | Call | 89.600 | -46,41 | 2.670 | 53.300,00 | |||
| 2026-02-11 | 13F | Simplex Trading, Llc | Put | 9.500 | -15,93 | 283 | ||||
| 2026-02-11 | 13F | CenterBook Partners LP | 37.647 | 1.122 | ||||||
| 2026-02-11 | 13F | Capital International Inc /ca/ | 540.613 | -12,42 | 16.110 | -13,67 | ||||
| 2026-02-13 | 13F | Transamerica Financial Advisors, Inc. | 1.311 | 39 | ||||||
| 2026-02-03 | 13F | Connable Office Inc | 30.042 | 0,00 | 895 | -1,43 | ||||
| 2026-04-24 | 13F | Profund Advisors Llc | 85.742 | -5,03 | 2.221 | -17,47 | ||||
| 2026-02-17 | 13F | Northern Trust Corp | 3.638.386 | -1,71 | 108.424 | -3,11 | ||||
| 2026-02-13 | 13F | Bollard Group LLC | 6.978 | 0 | ||||||
| 2026-02-09 | 13F | Accent Capital Management, LLC | 886 | 0,00 | 26 | 0,00 | ||||
| 2026-02-17 | 13F | Tudor Investment Corp Et Al | 383.077 | 11.416 | ||||||
| 2026-02-17 | 13F | Holocene Advisors, LP | 846.579 | 25.228 | ||||||
| 2026-02-10 | 13F | Channing Global Advisors, Llc | 84.938 | 1,17 | 2.531 | -0,28 | ||||
| 2026-04-21 | 13F | Aaron Wealth Advisors LLC | 54.010 | 110,89 | 1.399 | 83,22 | ||||
| 2026-04-14 | 13F | Granite Group Advisors, LLC | 0 | -100,00 | 0 | |||||
| 2026-01-20 | 13F | Nvwm, Llc | 14.142 | -47,27 | 421 | -48,02 | ||||
| 2026-01-29 | 13F | UBS Group AG | Put | 282.200 | 0,00 | 8.410 | -1,42 | |||
| 2026-01-28 | 13F | HB Wealth Management, LLC | 12.716 | 11,11 | 379 | 9,57 | ||||
| 2026-01-29 | 13F | UBS Group AG | Call | 49.900 | 0,00 | 1.487 | -1,39 | |||
| 2026-02-12 | 13F | Mount Yale Investment Advisors, LLC | 16.466 | 491 | ||||||
| 2025-11-14 | 13F | Millennium Management Llc | Call | 0 | -100,00 | 0 | -100,00 | |||
| 2026-01-29 | 13F | UBS Group AG | 3.953.404 | 25,75 | 117.811 | 23,97 | ||||
| 2026-04-23 | 13F | Klein Pavlis & Peasley Financial, Inc. | 132.985 | 7,40 | 3.444 | -6,67 | ||||
| 2026-02-13 | 13F | Vontobel Holding Ltd. | 2.692.556 | -39,54 | 80.238 | -40,40 | ||||
| 2026-04-15 | 13F | Compagnie Lombard Odier SCmA | 1.000 | 0,00 | 26 | -13,79 | ||||
| 2026-01-30 | 13F | Rachor Investment Advisory Services, LLC | 52 | 2 | ||||||
| 2026-02-09 | 13F | Keating Financial Advisory Services, Inc. | 108 | 3 | ||||||
| 2026-04-24 | 13F | Root Financial Partners, LLC | 299 | 225,00 | 8 | 250,00 | ||||
| 2026-02-12 | 13F | Systematic Alpha Investments, LLC | 11.300 | 0,00 | 337 | -1,47 | ||||
| 2026-02-13 | 13F | Segall Bryant & Hamill, Llc | 17.600 | 0,00 | 524 | -1,50 | ||||
| 2026-02-17 | 13F | GeoWealth Management, LLC | 17.205 | 24,13 | 513 | 22,49 | ||||
| 2026-02-06 | 13F | Vestmark Advisory Solutions, Inc. | 16.297 | 486 | ||||||
| 2026-02-13 | 13F | Baldwin Investment Management, LLC | 67.438 | 0,00 | 2.010 | -1,42 | ||||
| 2026-02-10 | 13F | Lido Advisors, LLC | 13.567 | 0,00 | 409 | -0,24 | ||||
| 2026-02-12 | 13F | Rossby Financial, LCC | 63 | 0,00 | 2 | 0,00 | ||||
| 2026-02-23 | 13F | Monetary Solutions, Ltd | 100 | 3 | ||||||
| 2026-02-09 | 13F | Wcm Investment Management, Llc | 53.308.528 | -1,59 | 1.591.260 | -3,08 | ||||
| 2026-02-17 | 13F | Limestone Investment Advisors LP | 57.300 | 1.708 | ||||||
| 2026-04-20 | 13F | Arta Finance Wealth Management LLC | 21.079 | -3,05 | 546 | -15,77 | ||||
| 2026-02-17 | 13F | Point72 Asset Management, L.P. | 1.467.733 | 1.806,15 | 43.738 | 1.779,59 | ||||
| 2026-02-13 | 13F | Kestra Advisory Services, LLC | 0 | -100,00 | 0 | |||||
| 2026-02-17 | 13F | Triveni Capital Investments LP | 405.413 | 12.081 | ||||||
| 2026-02-12 | 13F | Advisory Resource Group | 42.012 | 9,79 | 1.252 | 8,22 | ||||
| 2026-02-13 | 13F | Sompo Japan Nipponkoa Asset Management Co.,ltd. | 23.000 | -29,64 | 685 | -30,67 | ||||
| 2026-04-22 | 13F | Stone House Investment Management, LLC | 2 | -83,33 | 0 | |||||
| 2026-02-12 | 13F | JPL Wealth Management, LLC | 0 | -100,00 | 0 | |||||
| 2026-04-17 | 13F | Bell Investment Advisors, Inc | 1.811 | -13,47 | 47 | -25,81 | ||||
| 2026-01-30 | 13F | Sage Rhino Capital Llc | 0 | -100,00 | 0 | |||||
| 2026-01-30 | 13F | State of New Jersey Common Pension Fund D | 216.017 | 0,00 | 6.437 | -1,42 | ||||
| 2026-02-10 | 13F | Envestnet Asset Management Inc | 2.784.785 | -7,03 | 82.987 | -8,35 | ||||
| 2026-02-17 | 13F | Cdkv Holdings Llc | 1.100 | 33 | ||||||
| 2026-02-17 | 13F | Jump Financial, LLC | 683.794 | 20.377 | ||||||
| 2026-04-06 | 13F | Highline Wealth Partners Llc | 116 | -85,63 | 3 | -87,50 | ||||
| 2026-02-17 | 13F | Liontrust Investment Partners LLP | 283.445 | 7,90 | 8.447 | 6,36 | ||||
| 2026-02-19 | 13F | Mcguire Capital Advisors Inc | 68 | 2 | ||||||
| 2026-02-12 | 13F | New York State Common Retirement Fund | 1.334.585 | 28,28 | 39.771 | 26,45 | ||||
| 2026-01-26 | 13F | La Banque Postale Asset Management SA | 71.500 | 35,67 | 2.131 | 33,71 | ||||
| 2026-02-13 | 13F | Dynamic Technology Lab Private Ltd | 72.050 | 34,18 | 2.147 | 32,29 | ||||
| 2026-01-28 | 13F | Migdal Insurance & Financial Holdings Ltd. | 28.799 | -9,43 | 1 | |||||
| 2026-01-30 | 13F | Mitsubishi UFJ Trust & Banking Corp | 46.966 | 6,03 | 1.400 | 4,48 | ||||
| 2026-02-12 | 13F | BlackRock, Inc. | 8.438.158 | 47,45 | 251.457 | 45,36 | ||||
| 2026-02-18 | 13F | Vident Advisory, LLC | 219.902 | -1,97 | 6.553 | -3,36 | ||||
| 2026-02-13 | 13F | Schroder Investment Management Group | 7.547.726 | -4,44 | 224.922 | -5,80 | ||||
| 2026-04-15 | 13F | Seacrest Wealth Management, Llc | 11.832 | 0,00 | 306 | -17,52 | ||||
| 2026-02-05 | 13F | Cambridge Investment Research Advisors, Inc. | 9.240 | 7,62 | 0 | |||||
| 2026-04-24 | 13F | Ninety One SA (PTY) Ltd | 13.630 | 9,96 | 345 | -6,50 | ||||
| 2025-10-31 | 13F/A | OneAscent Financial Services LLC | 0 | -100,00 | 0 | |||||
| 2026-02-17 | 13F | Fwl Investment Management, Llc | 343.892 | 10,93 | 10.248 | 9,35 | ||||
| 2026-02-10 | 13F | Private Wealth Asset Management, LLC | 0 | -100,00 | 0 | |||||
| 2026-04-06 | 13F | GAMMA Investing LLC | 16.741 | -8,07 | 434 | -20,11 | ||||
| 2026-02-10 | 13F | Savant Capital, LLC | 18.988 | 46,70 | 566 | 44,50 | ||||
| 2026-02-17 | 13F | Aqr Capital Management Llc | 318.357 | 60,89 | 9.487 | 58,62 | ||||
| 2026-02-17 | 13F | Hood River Capital Management LLC | 480 | 14 | ||||||
| 2026-02-10 | 13F | Greenspring Advisors, LLC | 12.809 | 382 | ||||||
| 2026-02-13 | 13F | BNP Paribas Asset Management Holding S.A. | 735.814 | 22 | ||||||
| 2026-04-13 | 13F | Mather Group, Llc. | 6.316 | 164 | ||||||
| 2026-02-04 | 13F | Atlantic Union Bankshares Corp | 150 | 20,00 | 4 | 33,33 | ||||
| 2026-02-17 | 13F | United Capital Financial Advisers, Llc | 15.847 | -4,93 | 472 | -6,16 | ||||
| 2025-11-13 | 13F | Glenmede Investment Management, LP | 73.709 | 20,85 | 2.228 | 8,63 | ||||
| 2026-04-16 | 13F | SG Americas Securities, LLC | 2.662.894 | 202,67 | 69 | 161,54 | ||||
| 2026-01-22 | 13F | City Holding Co | 0 | -100,00 | 0 | -100,00 | ||||
| 2026-01-29 | 13F | Golden State Equity Partners | 7.956 | 3,95 | 237 | 2,60 | ||||
| 2026-02-13 | 13F | Virtus ETF Advisers LLC | 93.717 | -54,21 | 2.793 | -54,87 | ||||
| 2026-04-10 | 13F | Abound Wealth Management | 34 | -50,00 | 1 | -100,00 | ||||
| 2026-04-23 | 13F | Mayflower Financial Advisors, LLC | 0 | -100,00 | 0 | |||||
| 2025-12-09 | 13F/A | Tudor Investment Corp Et Al | Call | 0 | -100,00 | 0 | ||||
| 2026-02-17 | 13F | Jones Financial Companies Lllp | 5.950 | 15,24 | 177 | 12,74 | ||||
| 2026-02-06 | 13F | Motco | 0 | -100,00 | 0 | -100,00 | ||||
| 2026-02-13 | 13F | Arrowstreet Capital, Limited Partnership | 4.020.415 | 4,36 | 119.808 | 2,88 | ||||
| 2025-11-07 | 13F | Credit Industriel Et Commercial | 0 | -100,00 | 0 | |||||
| 2026-02-10 | 13F | Measured Wealth Private Client Group, LLC | 238 | 0,00 | 7 | 0,00 | ||||
| 2026-02-02 | 13F | Horizon Investments, LLC | 0 | -100,00 | 0 | |||||
| 2025-11-07 | 13F | Credit Industriel Et Commercial | Put | 0 | -100,00 | 0 | ||||
| 2026-02-13 | 13F | Thornburg Investment Management Inc | 192.359 | -8,52 | 5.732 | -9,82 | ||||
| 2026-02-13 | 13F | Citigroup Inc | 436.013 | -46,52 | 12.993 | -47,28 | ||||
| 2026-04-06 | 13F | CX Institutional | 40 | 0,00 | 0 | |||||
| 2026-01-23 | 13F | Gibbs Wealth Management | 0 | -100,00 | 0 | |||||
| 2026-01-28 | 13F | CAPROCK Group, Inc. | 62.559 | -1,73 | 1.864 | -8,45 | ||||
| 2026-02-17 | 13F | Brevan Howard Capital Management LP | 0 | -100,00 | 0 | |||||
| 2026-01-26 | 13F | Mirae Asset Global Investments Co., Ltd. | 125.727 | 1,01 | 3.747 | -0,43 | ||||
| 2026-02-17 | 13F | Two Sigma Investments, Lp | 4.032.212 | 181,26 | 120.160 | 177,26 | ||||
| 2026-02-17 | 13F | Two Creeks Capital Management, LP | 115.114 | 0,00 | 3.430 | -1,41 | ||||
| 2026-01-21 | 13F | Greenleaf Trust | 40.300 | 8,89 | 1.201 | 7,33 | ||||
| 2026-02-10 | 13F | Sivia Capital Partners, LLC | 15.059 | -1,53 | 449 | -3,03 | ||||
| 2026-02-12 | 13F | Jane Street Group, Llc | 1.703.511 | 461,30 | 50.765 | 453,35 | ||||
| 2026-02-10 | 13F | Td Asset Management Inc | 48.546 | 1,68 | 1.447 | 0,21 | ||||
| 2026-02-13 | 13F/A | Alberta Investment Management Corp | 0 | -100,00 | 0 | |||||
| 2026-04-24 | 13F | Sumitomo Mitsui DS Asset Management Company, Ltd | 48.205 | -2,81 | 1.249 | -15,56 | ||||
| 2026-02-12 | 13F | Jane Street Group, Llc | Put | 8.500 | -1,16 | 253 | -2,32 | |||
| 2026-02-02 | 13F | Cornerstone Planning Group LLC | 1.332 | 0,00 | 39 | -2,50 | ||||
| 2026-02-12 | 13F | Jane Street Group, Llc | Call | 68.500 | -16,05 | 2.041 | -17,23 | |||
| 2025-11-14 | 13F | Atom Investors LP | 0 | -100,00 | 0 | |||||
| 2026-01-21 | 13F | Flagship Harbor Advisors, Llc | 211 | 6 | ||||||
| 2026-02-09 | 13F | Legal & General Group Plc | 2.137 | 0,00 | 64 | -1,56 | ||||
| 2025-11-14 | 13F | Wolverine Trading, Llc | Put | 0 | -100,00 | 0 | -100,00 | |||
| 2026-04-27 | 13F | Y-Intercept (Hong Kong) Ltd | 0 | -100,00 | 0 | |||||
| 2026-01-23 | 13F | Rsm Us Wealth Management Llc | 32.032 | -0,78 | 956 | -1,95 | ||||
| 2026-02-13 | 13F | Wealth Alliance | 8.235 | 2,82 | 245 | 1,24 | ||||
| 2026-04-21 | 13F | Paradigm Financial Partners, Llc | 51.173 | -78,88 | 1.325 | -81,65 | ||||
| 2026-02-12 | 13F | Canopy Partners, LLC | 0 | -100,00 | 0 | |||||
| 2025-11-03 | 13F | Annis Gardner Whiting Capital Advisors, LLC | 0 | -100,00 | 0 | |||||
| 2026-01-23 | 13F | Helios Capital Management Pte. Ltd | 285.000 | 0,00 | 8.493 | -1,42 | ||||
| 2026-02-10 | 13F/A | Northwestern Mutual Wealth Management Co | 1.853 | -17,94 | 55 | -19,12 | ||||
| 2026-02-12 | 13F | Sepio Capital, LP | 0 | -100,00 | 0 | |||||
| 2026-02-17 | 13F | XTX Topco Ltd | 284.203 | 217,91 | 8.469 | 213,43 | ||||
| 2026-02-02 | 13F | Qrg Capital Management, Inc. | 30.343 | -4,62 | 904 | -5,93 | ||||
| 2026-01-28 | 13F | Kingswood Wealth Advisors, Llc | 6.740 | 201 | ||||||
| 2026-02-11 | 13F | Capital Group Investment Management Pte. Ltd. | 20.505 | -41,46 | 611 | -42,25 | ||||
| 2026-02-17 | 13F | DZ BANK AG Deutsche Zentral Genossenschafts Bank, Frankfurt am Main | 0 | -100,00 | 0 | |||||
| 2026-04-13 | 13F | IFP Advisors, Inc | 15.913 | -2,66 | 412 | -15,40 | ||||
| 2026-02-13 | 13F | Eschler Asset Management LLP | 0 | -100,00 | 0 | |||||
| 2026-02-17 | 13F | Janus Henderson Group Plc | 54.167 | -3,61 | 1.613 | -5,06 | ||||
| 2026-04-14 | 13F | Drive Wealth Management, Llc | 10.298 | -11,73 | 267 | -23,34 | ||||
| 2026-02-13 | 13F | Arkadios Wealth Advisors | 6.815 | 2,40 | 203 | 1,00 | ||||
| 2026-02-17 | 13F | Nomura Holdings Inc | 10.000 | -66,67 | 298 | -67,11 | ||||
| 2026-02-13 | 13F | Pathstone Holdings, LLC | 329.168 | -0,22 | 9.809 | -1,64 | ||||
| 2026-02-11 | 13F | Capital World Investors | 148.618 | 1,68 | 4.436 | 0,14 | ||||
| 2026-01-20 | 13F | Ascent Group, LLC | 19.122 | -1,28 | 570 | -2,74 | ||||
| 2026-02-17 | 13F | Artisan Partners Limited Partnership | 123.932 | 5,99 | 3.693 | 4,50 | ||||
| 2026-02-09 | 13F | MQS Management LLC | 0 | -100,00 | 0 | |||||
| 2026-01-23 | 13F | Westside Investment Management, Inc. | 2.442 | 5,81 | 73 | 4,29 | ||||
| 2026-02-13 | 13F | Evelyn Partners Investment Management LLP | 4.801 | 0,00 | 143 | -1,38 | ||||
| 2026-04-23 | 13F | SJS Investment Consulting Inc. | 0 | -100,00 | 0 | |||||
| 2026-03-02 | 13F | Tobam | 34.355 | 0,48 | 1 | 0,00 | ||||
| 2026-01-28 | 13F | Eagle Global Advisors Llc | 67.100 | 0,00 | 2.000 | -1,43 | ||||
| 2026-02-10 | 13F | Natixis Advisors, L.p. | 1.103.036 | -8,01 | 33 | -11,11 | ||||
| 2026-02-17 | 13F | Balyasny Asset Management Llc | 83.364 | 2.484 | ||||||
| 2026-01-27 | 13F | Jackson, Grant Investment Advisers, Inc. | 125 | 0,00 | 4 | 0,00 | ||||
| 2026-01-29 | 13F | Resonant Capital Advisors, LLC | 6.812 | -1,43 | 203 | -2,88 | ||||
| 2026-02-11 | 13F | Prestige Wealth Management Group LLC | 80 | -6,98 | 2 | 0,00 | ||||
| 2026-02-03 | 13F | NewEdge Wealth, LLC | 10.234 | 305 | ||||||
| 2026-02-10 | 13F | Bnp Paribas | 69.703 | 112,86 | 2.077 | 110,01 | ||||
| 2026-01-28 | 13F | Klp Kapitalforvaltning As | 190.000 | 76,42 | 5.662 | 73,95 | ||||
| 2026-02-10 | 13F | Nomura Asset Management Co Ltd | 1.467.150 | -3,91 | 43.721 | -5,27 | ||||
| 2026-02-17 | 13F | Clough Capital Partners L P | 0 | -100,00 | 0 | -100,00 | ||||
| 2026-02-03 | 13F | Sequoia Financial Advisors, LLC | 79.042 | -2,96 | 2.355 | -4,35 | ||||
| 2026-01-23 | 13F | Baillie Gifford & Co | 4.709.302 | -3,59 | 140.337 | -4,96 | ||||
| 2026-04-22 | 13F | RMR Wealth Builders | 15.362 | 0,00 | 398 | -13,13 | ||||
| 2026-02-17 | 13F | Public Employees Retirement System Of Ohio | 441.153 | -0,57 | 13.146 | -1,99 | ||||
| 2026-02-05 | 13F | Bank Julius Baer & Co. Ltd, Zurich | 152.650 | 11,75 | 4.549 | 10,15 | ||||
| 2026-02-03 | 13F | Indivisible Partners | 12.233 | 365 | ||||||
| 2026-02-09 | 13F | Harbour Investments, Inc. | 735 | 0,00 | 22 | -4,55 | ||||
| 2026-02-11 | 13F | Clearbridge Investments, LLC | 3.605.757 | -5,69 | 107.452 | -7,03 | ||||
| 2026-02-17 | 13F | Schonfeld Strategic Advisors LLC | 125.554 | 123,18 | 3.742 | 120,06 | ||||
| 2026-02-05 | 13F | Thrivent Financial For Lutherans | 268.849 | 1,08 | 8 | 0,00 | ||||
| 2026-02-12 | 13F | Adviser Investments LLC | 173.557 | 5,88 | 5.172 | 4,38 | ||||
| 2026-02-11 | 13F | Erste Asset Management GmbH | 0 | 0 | ||||||
| 2026-02-13 | 13F | Ubs Asset Management Americas Inc | 8.084 | -73,72 | 241 | -74,17 | ||||
| 2026-01-28 | 13F | DekaBank Deutsche Girozentrale | 343.641 | 0,00 | 10 | 0,00 | ||||
| 2025-11-06 | 13F | Wealthstream Advisors, Inc. | 12.656 | 14,15 | 383 | 2,69 | ||||
| 2026-02-17 | 13F | Wellington Management Group Llp | 6.016.402 | 53,95 | 179.289 | 51,76 | ||||
| 2026-02-17 | 13F | Blair William & Co/il | 158.327 | -0,97 | 4.718 | -2,38 | ||||
| 2026-04-09 | 13F | Park Place Capital Corp | 1.834 | 0,00 | 48 | -12,96 | ||||
| 2025-11-17 | 13F | Kestra Private Wealth Services, Llc | 0 | -100,00 | 0 | |||||
| 2026-01-28 | 13F | WPG Advisers, LLC | 5.594 | 0,43 | 167 | -1,19 | ||||
| 2026-02-05 | 13F | L & S Advisors Inc | 94.302 | -1,57 | 2.810 | -2,97 | ||||
| 2026-02-24 | 13F | MidFirst Bank | 201 | 6 | ||||||
| 2026-02-10 | 13F | Texas Yale Capital Corp. | 18.910 | 7,69 | 564 | 6,23 | ||||
| 2026-02-17 | 13F | Voloridge Investment Management, Llc | 3.304.107 | 20,60 | 98.462 | 18,88 | ||||
| 2025-11-12 | 13F | Kcm Investment Advisors Llc | 0 | -100,00 | 0 | |||||
| 2026-02-04 | 13F | Mirabaud Asset Management Ltd | 35.066 | 1.018 | ||||||
| 2026-04-21 | 13F | PDS Planning, Inc | 30.287 | -4,78 | 784 | -17,21 | ||||
| 2026-02-12 | 13F | Pitcairn Co | 0 | -100,00 | 0 | -100,00 | ||||
| 2026-03-04 | 13F/A | BSN Capital Partners Ltd | 1.150.000 | 34.845 | ||||||
| 2026-04-24 | 13F | Abacus Wealth Partners, LLC | 11.908 | -10,43 | 308 | -22,22 | ||||
| 2026-02-09 | 13F | Bleakley Financial Group, LLC | 47.498 | 10,95 | 1.415 | 9,35 | ||||
| 2025-10-31 | 13F | Whittier Trust Co Of Nevada Inc | 0 | -100,00 | 0 | |||||
| 2025-11-14 | 13F | Cubist Systematic Strategies, LLC | 51.357 | -56,19 | 1.553 | -60,64 | ||||
| 2026-02-13 | 13F | GQG Partners LLC | 74.633.839 | -1,32 | 2.224.088 | -2,72 | ||||
| 2026-02-17 | 13F | Temasek Holdings (Private) Ltd | 29.195.789 | 11,30 | 870.035 | 9,72 | ||||
| 2026-02-13 | 13F | Centiva Capital, LP | 19.020 | 567 | ||||||
| 2026-02-17 | 13F | Bank Of America Corp /de/ | 9.042.692 | -3,35 | 269.472 | -4,73 | ||||
| 2026-04-13 | 13F | True Wealth Design, LLC | 160 | -68,87 | 4 | -73,33 | ||||
| 2026-02-11 | 13F | Ramirez Asset Management, Inc. | 637 | 19 | ||||||
| 2026-04-13 | 13F | Hm Payson & Co | 0 | -100,00 | 0 | |||||
| 2026-02-06 | 13F | HighTower Advisors, LLC | 189.985 | 0,26 | 5.662 | -1,17 | ||||
| 2026-04-24 | 13F | Deltec Asset Management Llc | 35.500 | 0,00 | 919 | -13,06 | ||||
| 2026-02-05 | 13F | Bessemer Group Inc | 85.629 | 0,24 | 3 | 0,00 | ||||
| 2025-11-07 | 13F | Skandinaviska Enskilda Banken AB (publ) | 0 | -100,00 | 0 | -100,00 | ||||
| 2026-02-17 | 13F | Russell Investments Group, Ltd. | 2.829.163 | 7,59 | 84.309 | 6,06 | ||||
| 2025-11-06 | 13F | Oppenheimer & Co Inc | 0 | -100,00 | 0 | |||||
| 2026-02-06 | 13F | Global Retirement Partners, LLC | 34.924 | 503,49 | 1.041 | 497,70 | ||||
| 2026-02-13 | 13F | Stifel Financial Corp | 328.384 | -1,23 | 9.786 | -2,65 | ||||
| 2026-02-13 | 13F | Prudential Financial Inc | 78.249 | -7,23 | 2.336 | -8,40 | ||||
| 2026-01-29 | 13F | Aprio Wealth Management, LLC | 7.382 | -26,55 | 220 | -27,72 | ||||
| 2026-02-13 | 13F | Lord, Abbett & Co. Llc | 122.614 | -3,48 | 4 | 0,00 | ||||
| 2026-02-13 | 13F | Panagora Asset Management Inc | 1.829.696 | 15,17 | 54.525 | 13,53 | ||||
| 2025-11-14 | 13F | Navis Wealth Advisors, LLC | 0 | -100,00 | 0 | |||||
| 2026-01-07 | 13F | Aventura Private Wealth, LLC | 0 | -100,00 | 0 | |||||
| 2026-01-16 | 13F | Standard Life Aberdeen plc | 422.772 | 5,03 | 12.599 | 3,76 | ||||
| 2026-02-17 | 13F | New Vernon Capital Holdings II LLC | 675.644 | -18,04 | 20.134 | -19,20 | ||||
| 2026-01-07 | 13F | Harbour Capital Advisors, LLC | 12.045 | -8,65 | 361 | -11,52 | ||||
| 2026-02-11 | 13F | Westerkirk Capital Inc. | 13.682 | -53,72 | 408 | -54,42 | ||||
| 2026-02-13 | 13F | Mml Investors Services, Llc | 215.023 | 5,55 | 6.408 | 4,04 | ||||
| 2026-04-08 | 13F | Wealth Enhancement Advisory Services, Llc | 43.014 | -19,62 | 1.102 | -33,31 | ||||
| 2026-01-13 | 13F | Kathmere Capital Management, LLC | 10.103 | 2,44 | 301 | 1,01 | ||||
| 2026-01-23 | 13F | Bridgewater Advisors Inc. | 25.452 | -1,43 | 746 | -3,37 | ||||
| 2026-02-05 | 13F | LGT Group Foundation | 12.747 | -80,78 | 380 | -81,23 | ||||
| 2025-11-14 | 13F | AXA Investment Managers S.A. | 800.401 | 24.196 | ||||||
| 2026-02-12 | 13F | Federation des caisses Desjardins du Quebec | 66.587 | -6,94 | 1.984 | -8,23 | ||||
| 2026-02-17 | 13F | Advisory Services Network, LLC | 0 | -100,00 | 0 | -100,00 | ||||
| 2026-04-17 | 13F | Athena Wealth Management, LLC | 14.399 | -6,02 | 373 | -18,42 | ||||
| 2026-02-10 | 13F | Eurizon Asset Management Slovakia, sprav. spol., a.s. | 7.200 | 215 | ||||||
| 2026-04-24 | 13F | Key FInancial Inc | 274 | 0,00 | 7 | -12,50 | ||||
| 2026-02-12 | 13F | Bank Of Montreal /can/ | 2.586.177 | 53,00 | 77.068 | 50,82 | ||||
| 2025-11-06 | 13F | Dalton Investments LLC | 0 | -100,00 | 0 | -100,00 | ||||
| 2026-02-06 | 13F | Pnc Financial Services Group, Inc. | 251.430 | -2,76 | 7.493 | -4,15 | ||||
| 2026-01-30 | 13F | Turning Point Benefit Group, Inc. | 31 | 0,00 | 1 | |||||
| 2026-01-26 | 13F | Covenant Partners, LLC | 7.244 | 0,00 | 216 | -1,38 | ||||
| 2026-02-11 | 13F | Jpmorgan Chase & Co | Call | 107.500 | 0,00 | 3.204 | -1,42 | |||
| 2026-02-13 | 13F | Integrated Wealth Concepts LLC | 0 | -100,00 | 0 | |||||
| 2026-02-09 | 13F | AIA Group Ltd | 333.901 | 5,99 | 9.950 | 4,48 | ||||
| 2026-01-30 | 13F | Arlington Trust Co LLC | 0 | -100,00 | 0 | |||||
| 2026-02-19 | 13F | Atomi Financial Group, Inc. | 51.747 | -7,94 | 1.542 | -9,24 | ||||
| 2025-11-12 | 13F | Itau Unibanco Holding S.A. | 0 | -100,00 | 0 | |||||
| 2026-02-11 | 13F | Jpmorgan Chase & Co | 15.422.841 | -16,40 | 459.601 | -17,59 | ||||
| 2026-01-26 | 13F | Cwm, Llc | 8.858 | 11,30 | 0 | |||||
| 2026-02-17 | 13F | Laird Norton Trust Company, Llc | 200.866 | 5.986 | ||||||
| 2026-02-12 | 13F | Steward Partners Investment Advisory, Llc | 14.387 | -86,97 | 429 | -87,17 | ||||
| 2026-02-17 | 13F | Capital Fund Management S.a. | Put | 0 | -100,00 | 0 | -100,00 | |||
| 2026-02-02 | 13F | Truist Financial Corp | 57.360 | -1,81 | 1.709 | -3,17 | ||||
| 2026-01-08 | 13F | Nordea Investment Management Ab | 535.498 | -5,10 | 15.950 | -6,41 | ||||
| 2026-02-13 | 13F | PCM Encore, LLC | 58.251 | 1.736 | ||||||
| 2026-02-12 | 13F | Triumph Capital Management | 24 | 1 | ||||||
| 2026-02-17 | 13F | Driehaus Capital Management Llc | 4.063.452 | -24,18 | 121.091 | -25,26 | ||||
| 2026-04-21 | 13F | PharVision Advisers, LLC | 0 | -100,00 | 0 | |||||
| 2026-02-17 | 13F | Grantham, Mayo, Van Otterloo & Co. LLC | 11.293 | -24,08 | 337 | -25,17 | ||||
| 2025-11-14 | 13F | Fullerton Fund Management Co Ltd | 0 | -100,00 | 0 | |||||
| 2026-04-22 | 13F | Union Bancaire Privee, UBP SA | 10.295 | -72,31 | 259 | -76,65 | ||||
| 2026-02-17 | 13F | Captrust Financial Advisors | 41.434 | 5,74 | 1.235 | 4,22 | ||||
| 2026-02-11 | 13F | Renaissance Group Llc | 214.961 | -8,15 | 6.406 | -9,47 | ||||
| 2026-01-07 | 13F | Sagespring Wealth Partners, Llc | 11.887 | -3,13 | 354 | -4,32 | ||||
| 2026-01-30 | 13F | Flossbach Von Storch Ag | 200.000 | 25,00 | 5.960 | 23,24 | ||||
| 2026-02-12 | 13F | Campbell & CO Investment Adviser LLC | 198.633 | 5.919 | ||||||
| 2026-01-23 | 13F | Hardman Johnston Global Advisors LLC | 5.526.617 | -3,65 | 164.693 | -5,02 | ||||
| 2026-02-13 | 13F | Wells Fargo & Company/mn | 263.154 | 1,42 | 7.842 | -0,03 | ||||
| 2025-11-07 | 13F | Avestar Capital, LLC | 0 | -100,00 | 0 | |||||
| 2026-02-17 | 13F | Caisse De Depot Et Placement Du Quebec | 217.800 | 0,00 | 6.490 | -1,43 | ||||
| 2026-04-22 | 13F | Sterling Capital Management LLC | 19.129 | 495 | ||||||
| 2026-04-23 | 13F | J.w. Cole Advisors, Inc. | 63.841 | 22,59 | 1.653 | 407,06 | ||||
| 2026-02-11 | 13F | Franklin Resources Inc | 6.389.624 | -1,05 | 190.411 | -2,45 | ||||
| 2026-02-13 | 13F | Healthcare Of Ontario Pension Plan Trust Fund | 2.413.800 | 19,86 | 71.931 | 18,16 | ||||
| 2026-02-17 | 13F | Wiley Bros.-aintree Capital, Llc | 33.595 | 5,44 | 1.003 | 4,05 | ||||
| 2026-02-05 | 13F | Lockheed Martin Investment Management Co | 33.100 | -92,16 | 986 | -92,27 | ||||
| 2026-04-08 | 13F | Thompson Investment Management, Inc. | 5.940 | 0,00 | 154 | -13,56 | ||||
| 2026-04-15 | 13F | Generali Investments CEE, investicni spolecnost, a.s. | 81.292 | 0,00 | 2.105 | -13,09 | ||||
| 2026-04-16 | 13F | Park National Corp /oh/ | 0 | -100,00 | 0 | |||||
| 2026-02-05 | 13F | Atria Investments Llc | 42.393 | 11,10 | 1.263 | 9,54 | ||||
| 2026-02-17 | 13F | Alua Capital Management LP | 4.105.717 | 0,00 | 122.350 | -1,42 |